Audience: Creators Status: User Guide
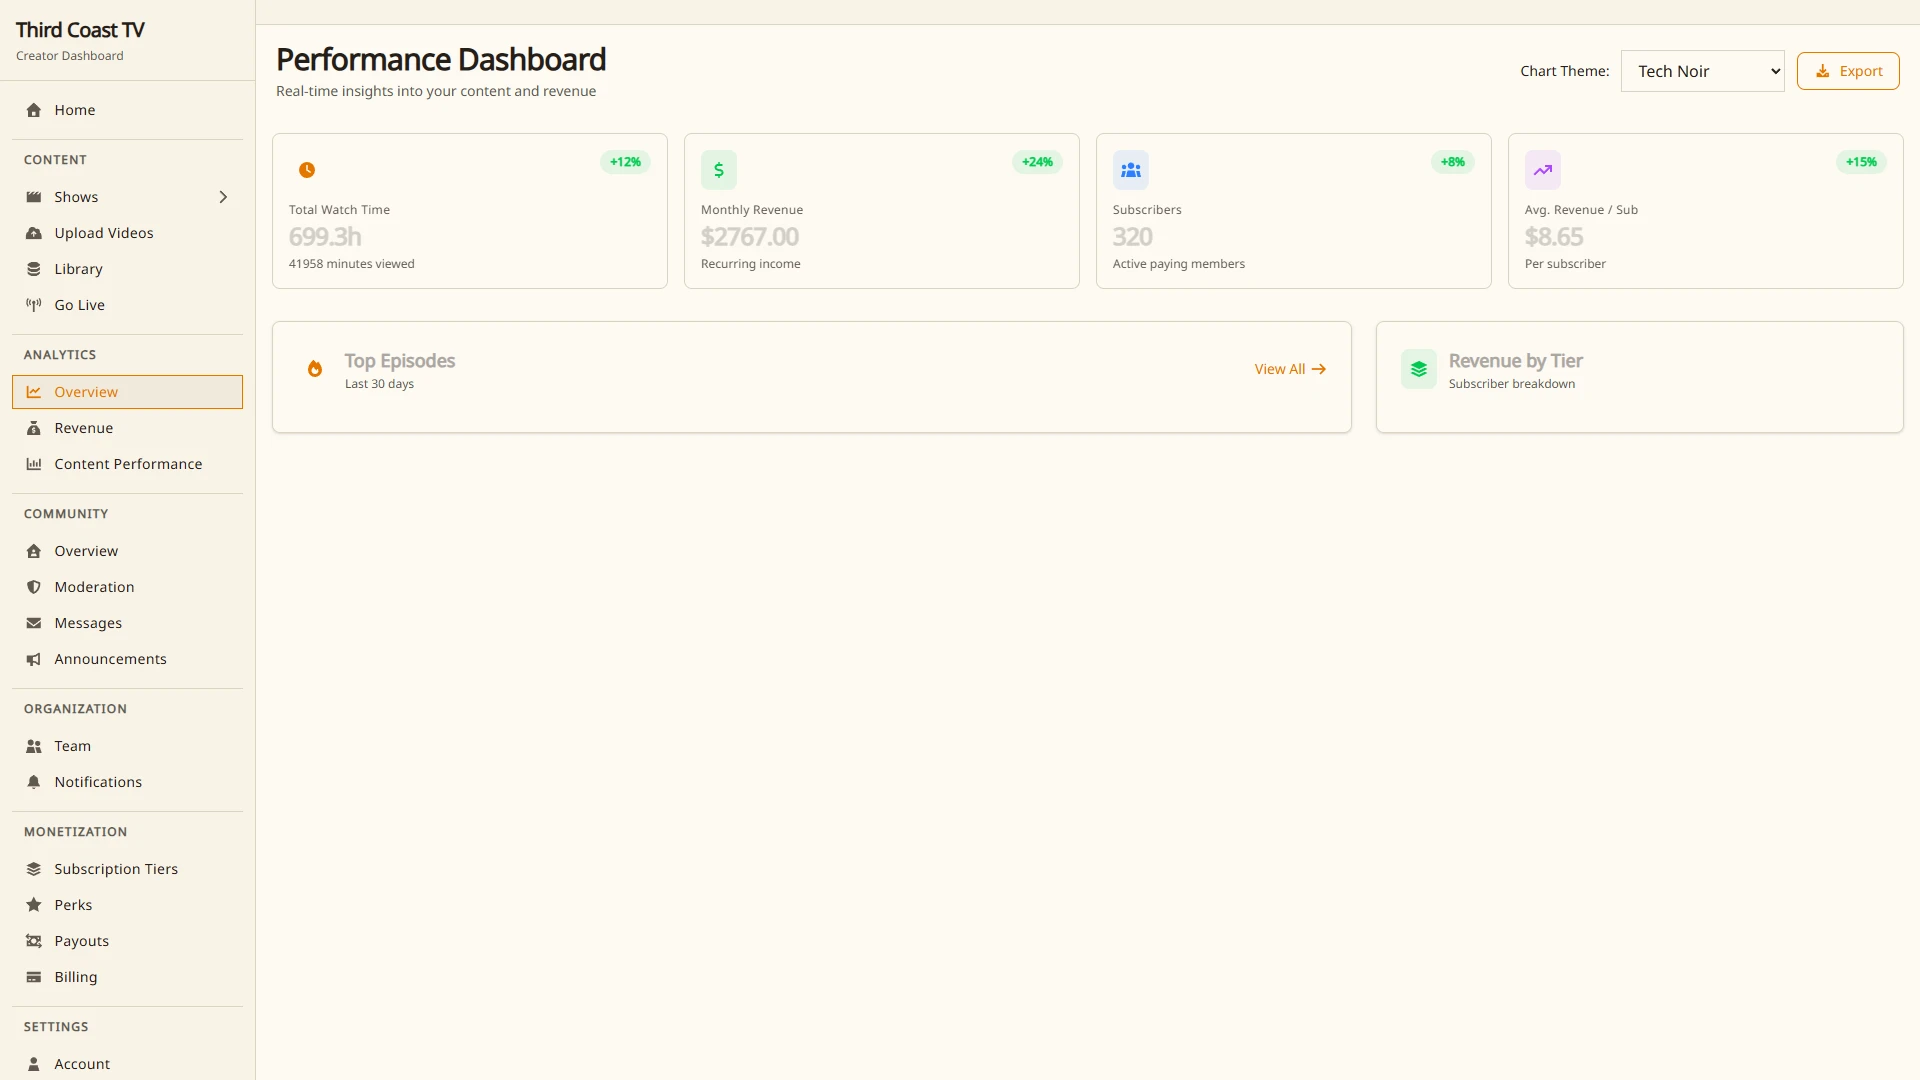
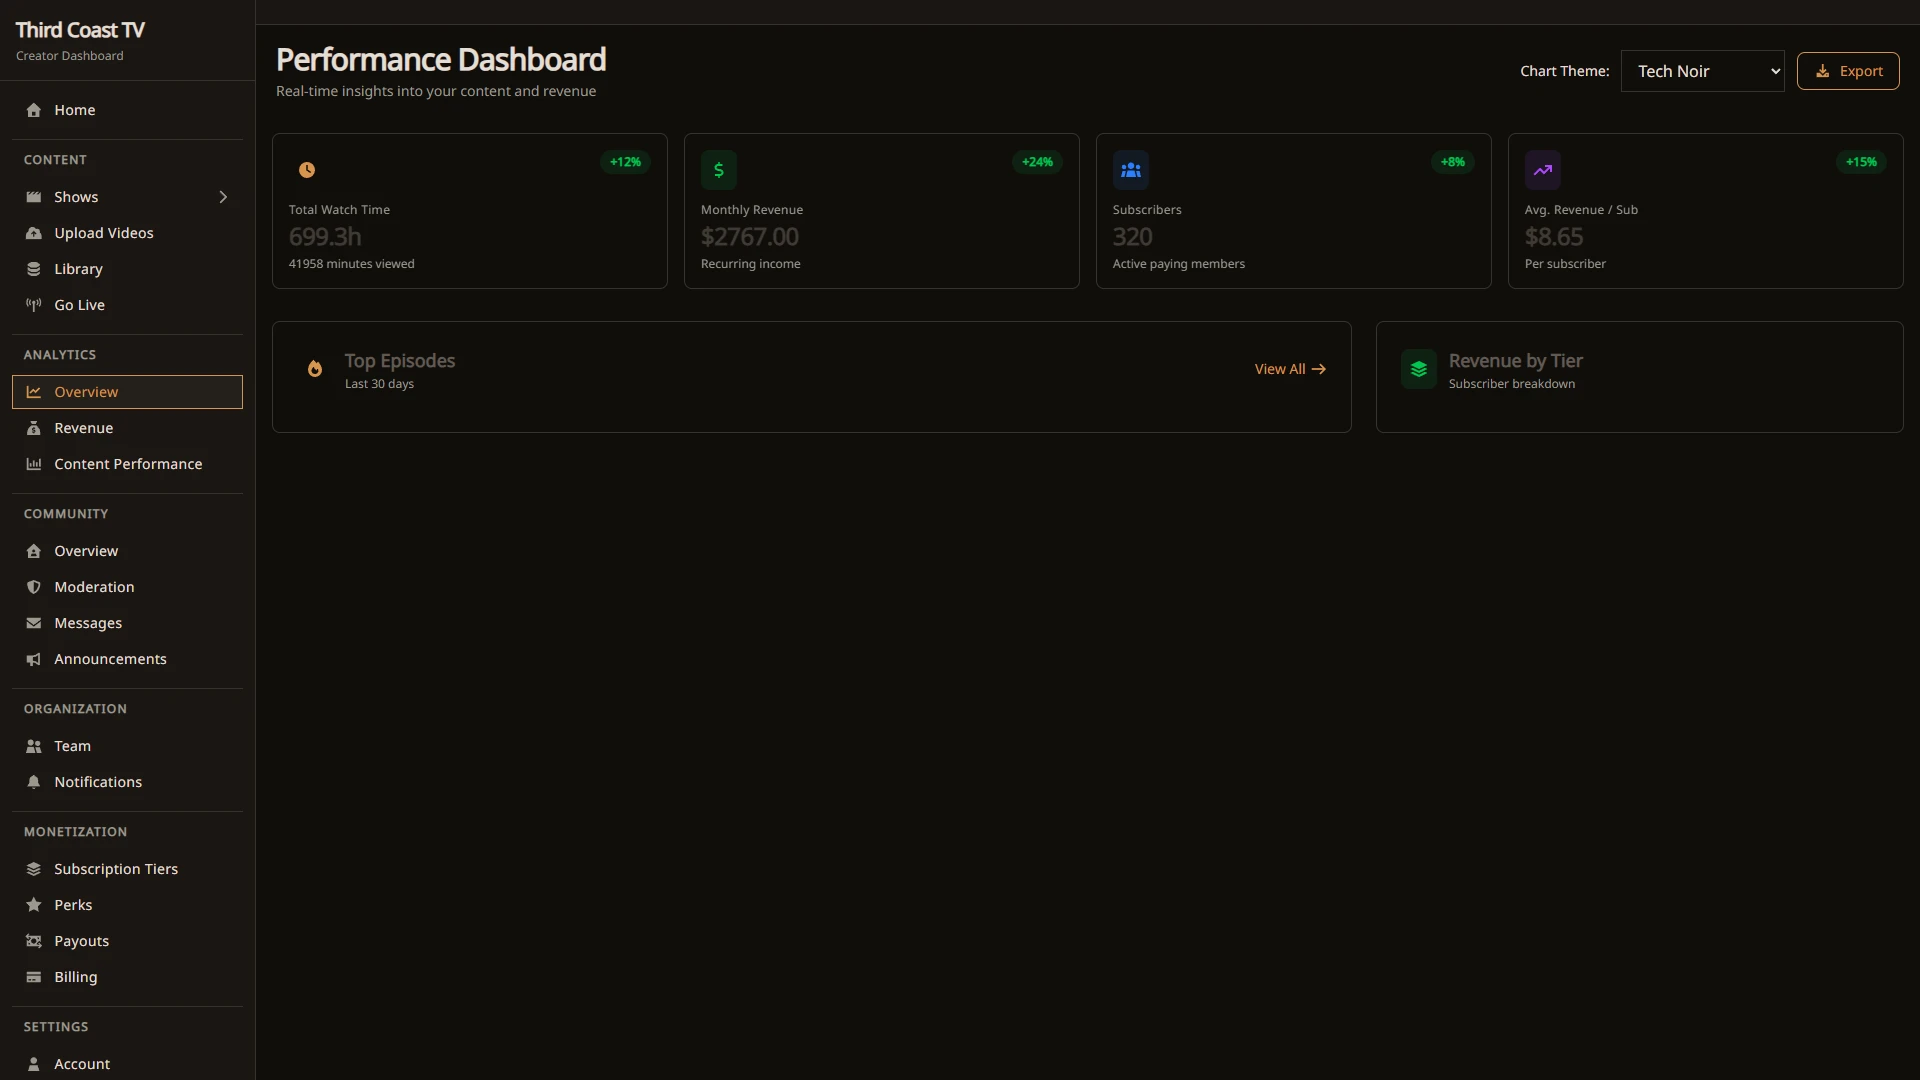
Analytics show you how your content is doing: how much people watch, where they watch from, which moments hold attention, and what you earn. The numbers are gathered as people view your episodes and rolled up into the dashboards described below.
You reach everything from Analytics in the sidebar.
Where the numbers come from
View and watch data is recorded as people watch and stored for reporting. You do not need to set anything up. Most figures update on their own, though some breakdowns settle over a short period as data finishes processing, so very recent numbers can keep moving for a little while.
You can set a date range on most pages. By default you see a recent window, and you can widen or narrow it to compare periods.
When a view counts
A play has to clear a watch threshold before it counts as a qualified view. For a short clip the bar is high, around the full first 30 seconds. The required share of the video eases down for longer content, so a feature-length episode does not need to be watched in full to count. The threshold looks at continuous watch time, so someone who opens an episode and leaves right away is not counted.
Overview
Analytics → Overview is the summary of your whole organization. It brings together your watch time over the selected range, a time-series chart so you can see trends day by day or hour by hour, and a breakdown of where your audience is watching from.
Geography
The geography breakdown groups watch time by country. It is useful for spotting where your audience is concentrated, planning live start times across time zones, and noticing new regions as they grow. Countries are resolved from viewer location, and watch time that cannot be matched to a country is left out of the breakdown.
Revenue
Analytics → Revenue shows what your content earns. Your revenue comes from the ways you monetize on the platform:
- Subscription tiers, the recurring memberships your audience pays for.
- Perks, add-ons tied to a subscription.
- Episode purchases, one-time payments to watch a specific episode, including paid live broadcasts.
- Coin gifts and gift subscriptions from your audience.
Earnings are shown net of the platform fee. The platform takes an 8 percent fee on audience revenue, and your share is recorded as gross, fee, and net. Net earnings are what get paid out to you. For how money reaches your account, see the payouts guide.
Standard card processing fees from the payment provider also apply to each transaction, so revenue figures reflect your net share rather than the gross a customer paid.
Content Performance
Analytics → Content Performance ranks your episodes so you can see what is working. From here you can open any single episode for its own detailed view.
Per-episode analytics
Each episode has its own analytics page covering its watch time over time and its own geography breakdown. This is the place to compare an individual episode against your overall numbers and to see how a release performed after it went live.
Playback analytics
For episodes with a processed recording, playback analytics show how people move through the video itself. Open an episode and choose its playback analytics view to see three things.
Retention curve
The retention curve plots how many of the people who started the episode are still watching at each point in the video, measured at short intervals from start to finish. The first moment is the baseline, and the line shows the share of those viewers still present later on. A steep early fall means people are leaving near the start. A gentle slope means the episode is holding attention.
Interest graph
The interest graph highlights the moments people seek to. It combines rewinds and skips, with rewinds weighted more heavily because going back to rewatch a moment is a strong signal of interest. Peaks point to the parts of your episode that viewers replay or jump to most.
Drop-off points
Drop-off points call out the moments where you lose a meaningful share of viewers in a short span. The page scans the retention curve for windows where the audience falls by a notable amount and lists those timestamps, so you can go straight to the spots worth reviewing instead of reading the whole curve by eye.
Storage usage
Analytics also includes a storage view. It shows how much of your video library you are currently storing, how that has changed over your selected range, and how your usage compares against your plan. Use it to keep an eye on how close you are to your plan’s limits as your catalog grows.
Tips for reading your numbers
- Compare an episode against your own baseline rather than chasing absolute counts. The shape of a retention curve tells you more than a single view total.
- Use drop-off points and the interest graph together. A drop-off right after a slow stretch, or a replayed peak, tells you what to do more or less of.
- Check geography before scheduling live broadcasts so your start time lands well for the audience you actually have.
- Keep an eye on the storage view as your library grows so an upgrade never catches you by surprise.